Bazel Remote Cache Debugging
![[object Object]](https://avatars.githubusercontent.com/u/2414826?v=4)
Using a remote cache is a great way to speed up your Bazel builds! But by default, Bazel uploads almost everything to the remote cache.
If your network is slow and your build artifacts are very large (like a docker image) this can lead to poor performance.
To address this, and make it easier to fix, we built the new cache requests card.
In this post we'll explore what insights this card can give you into your builds, as well as some fun details about how the card works under the hood.
New insights
The cache requests card lets you answer some interesting questions about your build which were not easily answerable before. Here are a few:
My build seems to have uploaded a lot of data — which targets uploaded the largest artifacts?
To answer this question, select "Sort by Size" and "Show All". Then, select "Group by None". This will show the largest artifacts first, with target names displayed in the leftmost column.
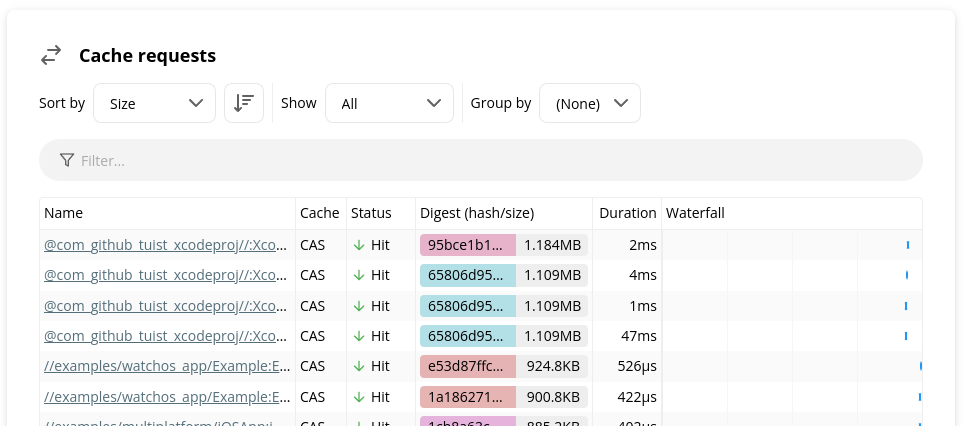
We can see in this screenshot that the largest cache transfer was a
download of an artifact from the external repository
com_github_tuist_xcodeproj. To see the full target and action name,
hover over the row.
I see some file references in the build event stream which aren't associated with an action. What are these files?
To answer this question, select "Show All" and search for bes-upload. You'll see all the files which were uploaded by Bazel and not associated with an action, including the timing profile.
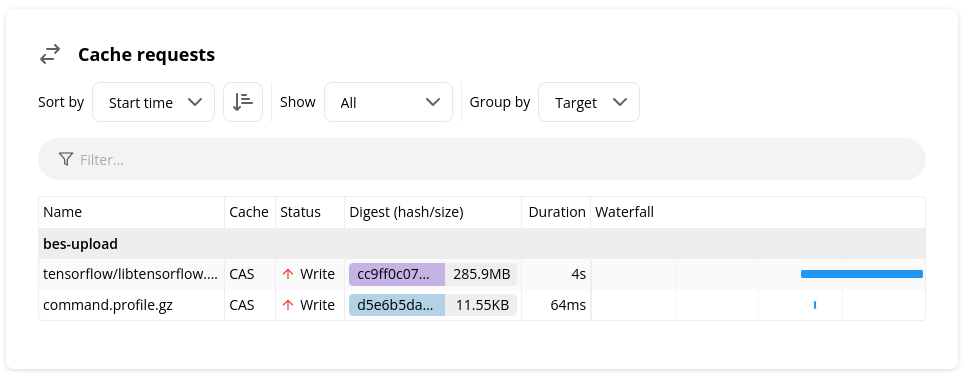
The build in this screenshot shows that a large artifact (285.9 MB) was uploaded at the very end of the build, so it most likely was blocking the build's completion. We can see the full artifact path by hovering over the row.
I expected my build to be fully-cached, but it was not. Was there a single action whose inputs or environment variables changed unexpectedly, thus triggering all its dependent targets to be rebuilt?
To answer this question, make sure you are sorted by start time in ascending order, and take a look at the actions with the earliest timestamps. The earliest action is most likely the root cause of the change from the previous build.
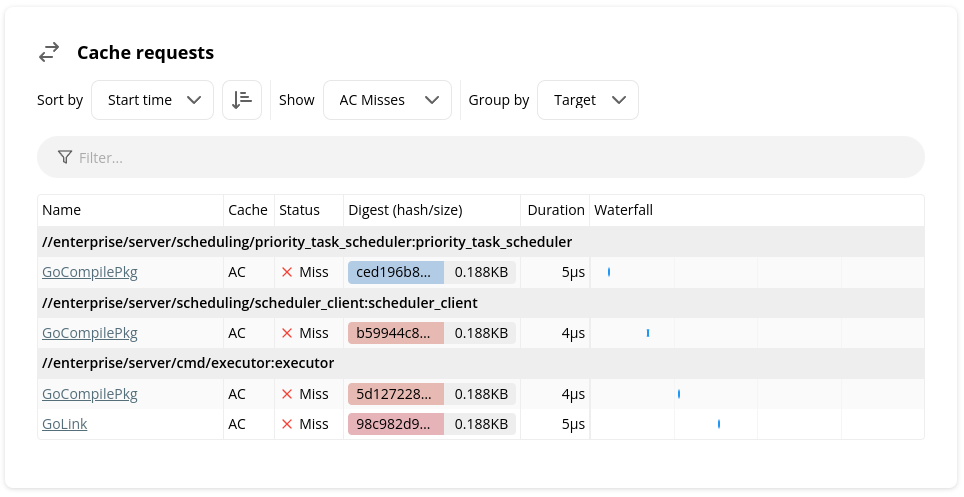
Before the build in this screenshot, a file in the
priority_task_scheduler target was edited, which we can see triggered a
cascade of action executions that transitively depended on
priority_task_scheduler.
How it works
Implementing the cache requests card required solving a few interesting problems.
The total size of the request metadata stored for each build is not extremely large — just tens of megabytes for builds with hundreds of thousands of cache requests — but we serve a high volume of requests, and we don't want to negatively impact cache performance just to store this metadata for each request.
The simplest solution to implement would be to do a blocking write to a MySQL table for each cache request. This would also be pretty convenient for querying the data however we like. However, this would place far too much load on the database and add way too much latency to each cache request.
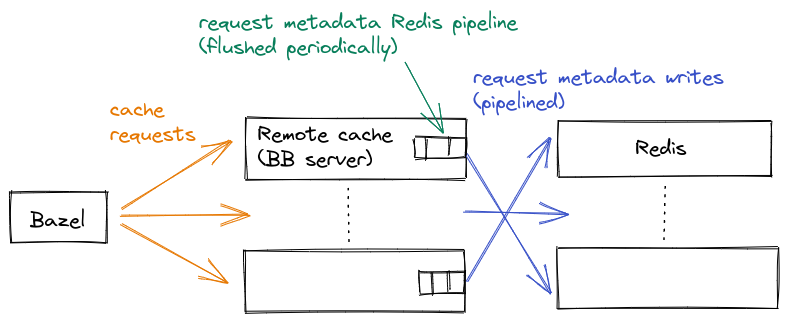
So, instead of using MySQL, we used Redis as an intermediate storage medium while the invocation is in progress. Redis can handle a much higher volume of writes than MySQL because it only stores values in memory and it has a much simpler key-value storage model.
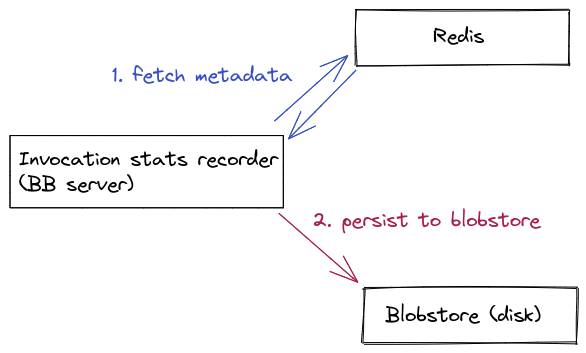
We can't just store this data in Redis and call it a day, though. Firstly, Redis does not give us long-term persistence, and it would be nice to be able to keep this data around even for older invocations. To get long-term persistence, we read all of the data from Redis and then serialize it into a proto. We store this proto into a "blobstore," which is just a generic storage interface backed by a local disk, Google Cloud Storage, Amazon S3, etc.
Secondly, even with the amazing performance of Redis, we can't just issue
a single write request for every cache request. Doing a separate Redis
write for every request places a large amount of CPU load on Redis, since
it needs to do a read() and write() system call for each write.
(We learned this the hard way.)
To address this, we used Redis pipelining. Instead of issuing Redis commands directly, we add each command to a pipeline, and have a separate background job that periodically flushes the pipeline. Adding the command to the pipeline is just a matter of appending to an in-memory buffer, which takes just nanoseconds, so it doesn't impact cache performance to a significant degree.
Once an invocation is complete, we kick off a job to read all of the requests from Redis and then store it as a single blob in blobstore.
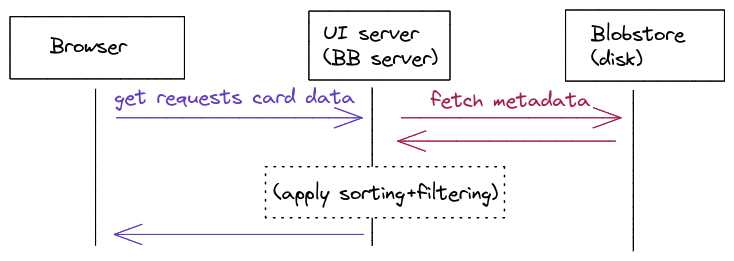
To read back this data for the UI, all we have to do is load this whole blob into memory and then apply any client-side sorting and filtering. These blobs are small enough that we easily load the full blob into memory on the server — the blob is too big to be loaded in a browser, though, so we do use a relatively small page size.
What's next
We hope that you find the new cache requests card useful and that you enjoyed reading about how it works! We would love to hear your feedback, which will help inform how we design the next iteration of our cache debugging tools to help make your builds even faster and more scalable. Join our Slack channel or email us at hello@buildbuddy.io with any questions, comments, or thoughts.