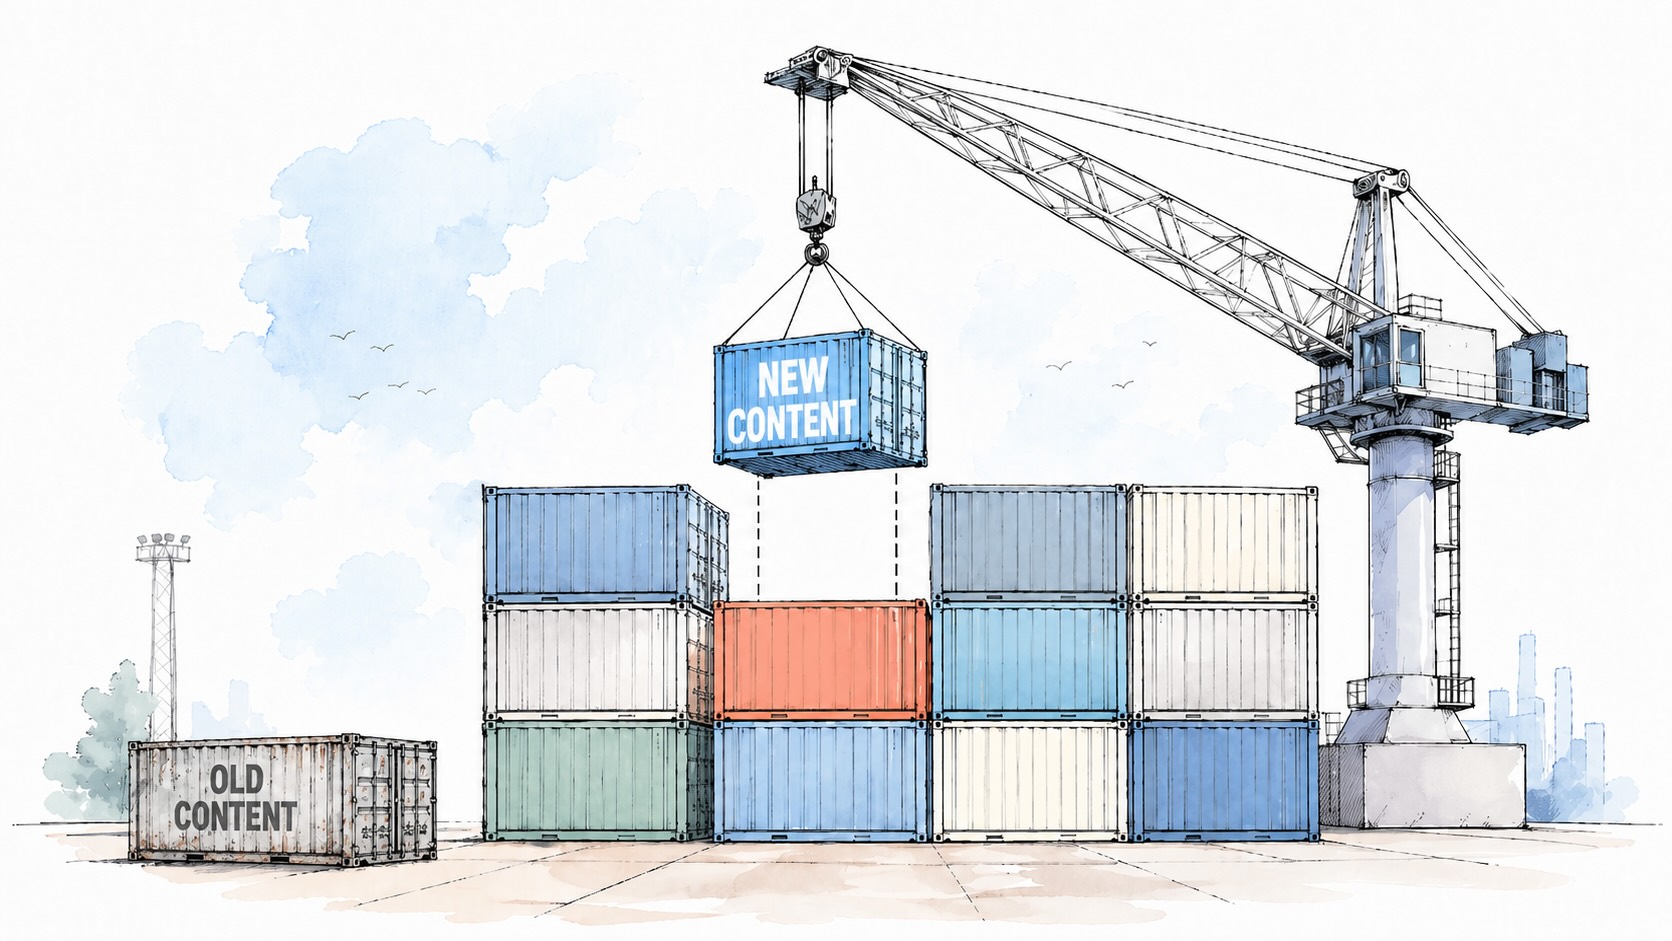
The goal: move the changed bytes, not the whole output.
BuildBuddy's Remote Cache uses Content-Defined Chunking (CDC) to make large build outputs behave more incrementally. When a binary, bundle, package, or archive is mostly unchanged, BuildBuddy can reuse chunks it has already seen instead of re-uploading or re-downloading the entire file.
In our Bazel chunking implementation PR, we observed 40% less data uploaded and a 40% smaller disk cache when benchmarked on BuildBuddy's own repo. To enable client-side CDC with BuildBuddy, use Bazel 8.7 or 9.1+ and pass --experimental_remote_cache_chunking.
We're excited to share that Keith Smiley is joining BuildBuddy's engineering team. Keith brings an incredible depth of experience in build systems and developer tooling that will directly benefit our users and the broader Bazel ecosystem.
Keith is a maintainer of Bazel's rules_apple and rules_swift, contributing over 1,500 pull requests to the Bazel ecosystem. Beyond Bazel, Keith is a contributor to both LLVM and Swift. In 2021, he launched the Mobile Native Foundation with the Linux Foundation, and in 2023 he received Google's Open Source Peer Bonus award for his contributions.
Keith joins us from Modular, where he was a Senior Staff Engineer focused on developer experience. Prior to Modular, Keith was a Principal Engineer at Lyft, where he founded and led their mobile developer experience team, and migrated their multi-million line iOS codebase to Bazel.
We look forward to working alongside Keith to build the future of developer tools.
Configuring AI coding agents to use Remote Bazel can unlock significant performance improvements for builds and tests. With more compute, a warm analysis cache, and fast network access
to co-located remote caches, our remote runners are optimized to ensure agents' time is well spent on logic and reasoning, instead of waiting for builds to complete.
For more details on what Remote Bazel is and some sample use cases, see our blog post on Remote Bazel. For more details on the technical setup
of our remote runners, see this blog post.
AI coding agents like Claude, Cursor, and Codex are transforming how developers write software. For many developers coding with agents, the bottleneck has shifted from writing code to validating code written by agents - with builds and tests.
Remote Bazel ensures these builds and tests run quickly by running them on powerful remote runners. These runners are colocated with cache and RBE servers, reducing network latency. They can be cloned and reused for future builds, ensuring a warm analysis cache. All the local machine needs to do is stream back the logs.
We're excited to announce that BuildBuddy's remote execution platform now supports the ARM64 (AArch64) architecture. This means you can run your builds and tests natively on ARM64 executors, unlocking faster builds for ARM64 targets and enabling teams to test on the same architecture they deploy to.
For several years now, we’ve supported native ARM64 builds using Bring Your Own Runners (BYOR) or using our cloud mac build machines. As more customers transition to the ARM architecture for cost or performance reasons, we want to make it even easier for your builds to run natively on Linux + ARM64 as well. So we’re closing the loop and adding support for autoscaled cloud Linux ARM64 runners. This means that no matter how big your build, we’re able to handle it, and you’ll only pay for the resources you actually use.
We’ve made it easy to get started with ARM builds by adding support to the buildbuddy-toolchain to automatically detect your architecture and set the platform appropriately. This makes maintaining a project that builds on both ARM64 and x86-64 ergonomic and easy, and removes the need for slow cross-compilation.
BuildBuddy's remote execution engine merges in-flight executions of identical actions to save our users time and resources. In this blog post, we'll explain why action merging is important, how it works, and some fun stuff we've learned over the years running our implementation in production.
At BuildBuddy, our mission is to bring the world's best developer tools to every company. In order to achieve this mission, we need to build a team that has experience using Bazel at scale. That's why we're so excited to share that Tyler French is joining BuildBuddy's engineering team.
At BuildBuddy, our mission is to bring the world's best developer tools to every company. In order to achieve this mission, we need to build a team that has experience leading and scaling the fastest growing developer tools companies in the world. That's why we're so excited to share that Dan Stowell is joining BuildBuddy's engineering team.
Dan joins us from Vercel, where he was a Director of Engineering. Prior to Vercel, Dan was the Head of Engineering at Replit and a Principal Engineer at Spotify.
We look forward to working alongside Dan to build the future of developer tools.
We discovered a bug in Bazel that was causing builds with --remote_download_minimal to download all output artifacts.
A fix has been submitted upstream to the Bazel repository and will be included in the Bazel 9.x release. It will also be cherry-picked back to versions 8.2.0 and 7.6.0.
Users on older versions of Bazel can work around this issue by setting --experimental_remote_cache_ttl to a large value, such as 10000d, with some caveats.
Upgrading Bazel and the related dependencies can sometimes lead to unexpected issues.
These issues can range from build failures to runtime errors, and generally, they can be hard to troubleshoot.
So today, we will discuss how to narrow down the root cause of build failures after a dependency upgrade using git bisect.
At BuildBuddy, our mission is to bring the world's best developer tools to every company. A core part of that mission involves building systems and infrastructure that can handle the scale of the world's largest enterprises. That's why we're so excited to share that Vanja Pejovic is joining BuildBuddy's engineering team.
Vanja joins us from Google, where he spent over 12 years as a Software Engineer. He brings with him his experience working on Google's internal RBE (remote build execution) system, Forge.
We look forward to working alongside Vanja to build the future of developer tools.
![[object Object]](https://avatars.githubusercontent.com/u/66684063?v=4)
![[object Object]](https://avatars.githubusercontent.com/u/1704556?v=4)

![[object Object]](https://avatars.githubusercontent.com/u/13951661)
![[object Object]](https://avatars.githubusercontent.com/u/735684?v=4)
![[object Object]](https://avatars.githubusercontent.com/u/455246?v=4)

![[object Object]](https://avatars.githubusercontent.com/u/26684313?v=4)