Build & Test UI
Get visibility into your builds and test results. Share links to your local builds with your co-workers and debug together.
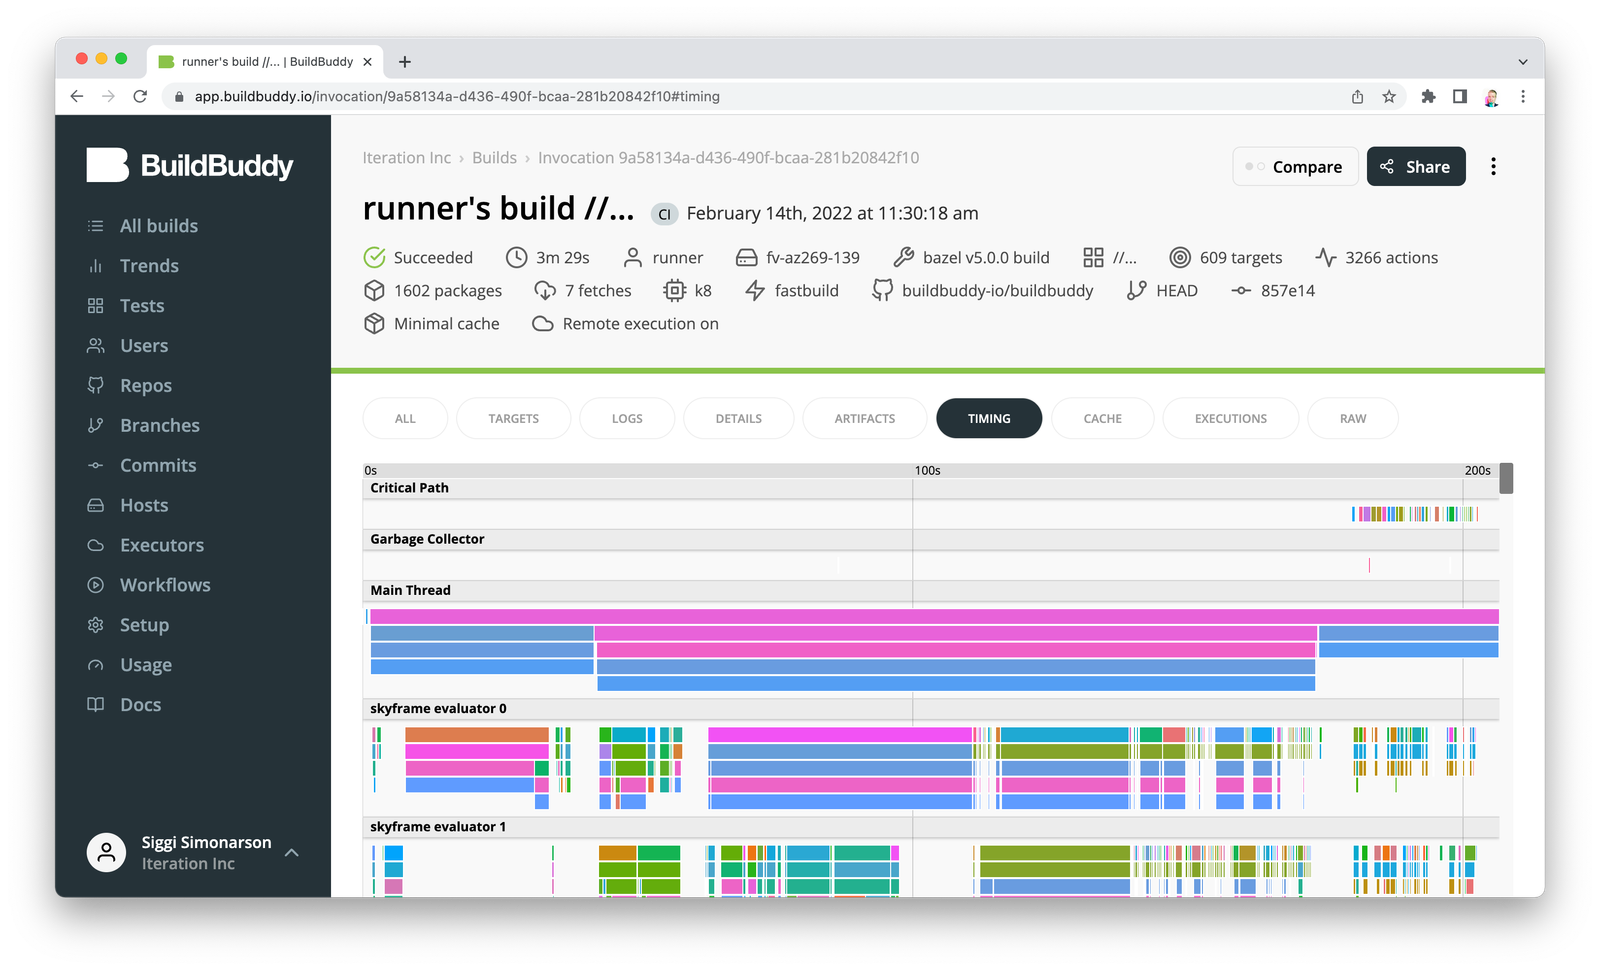
Timing profile
With the in-product timing profile you can dive deep into where time is being spent for each and every build — with just one click.
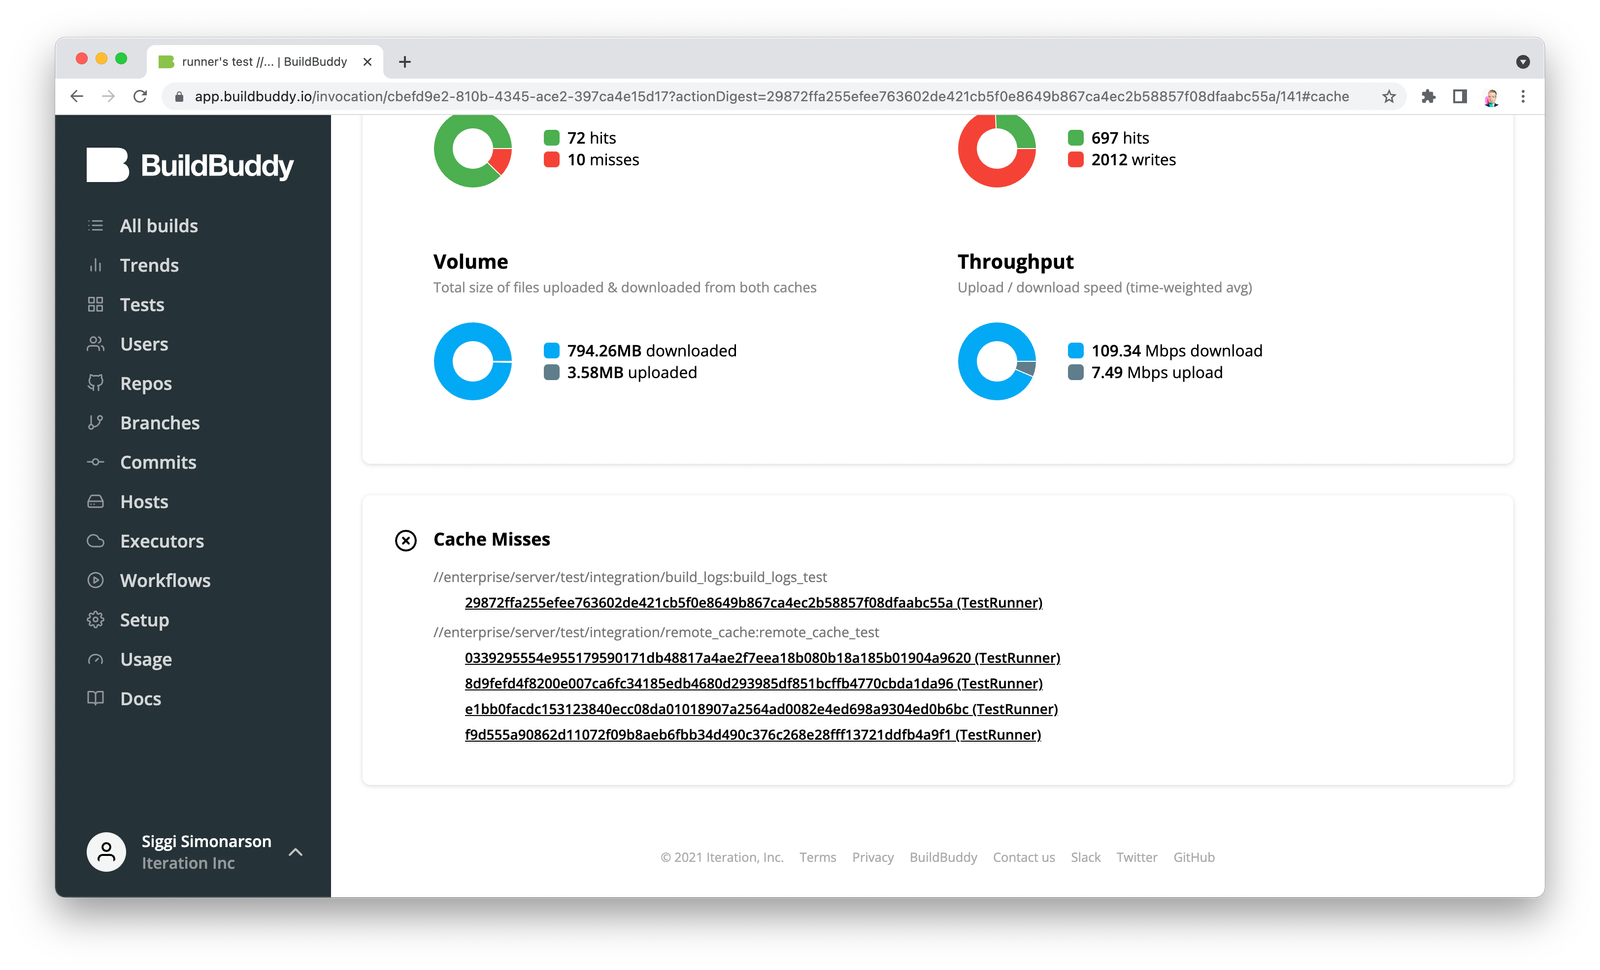
Cache stats
Debug cache misses and monitor cache performance. Examine individual invocations, or track cache hit ratios across builds.
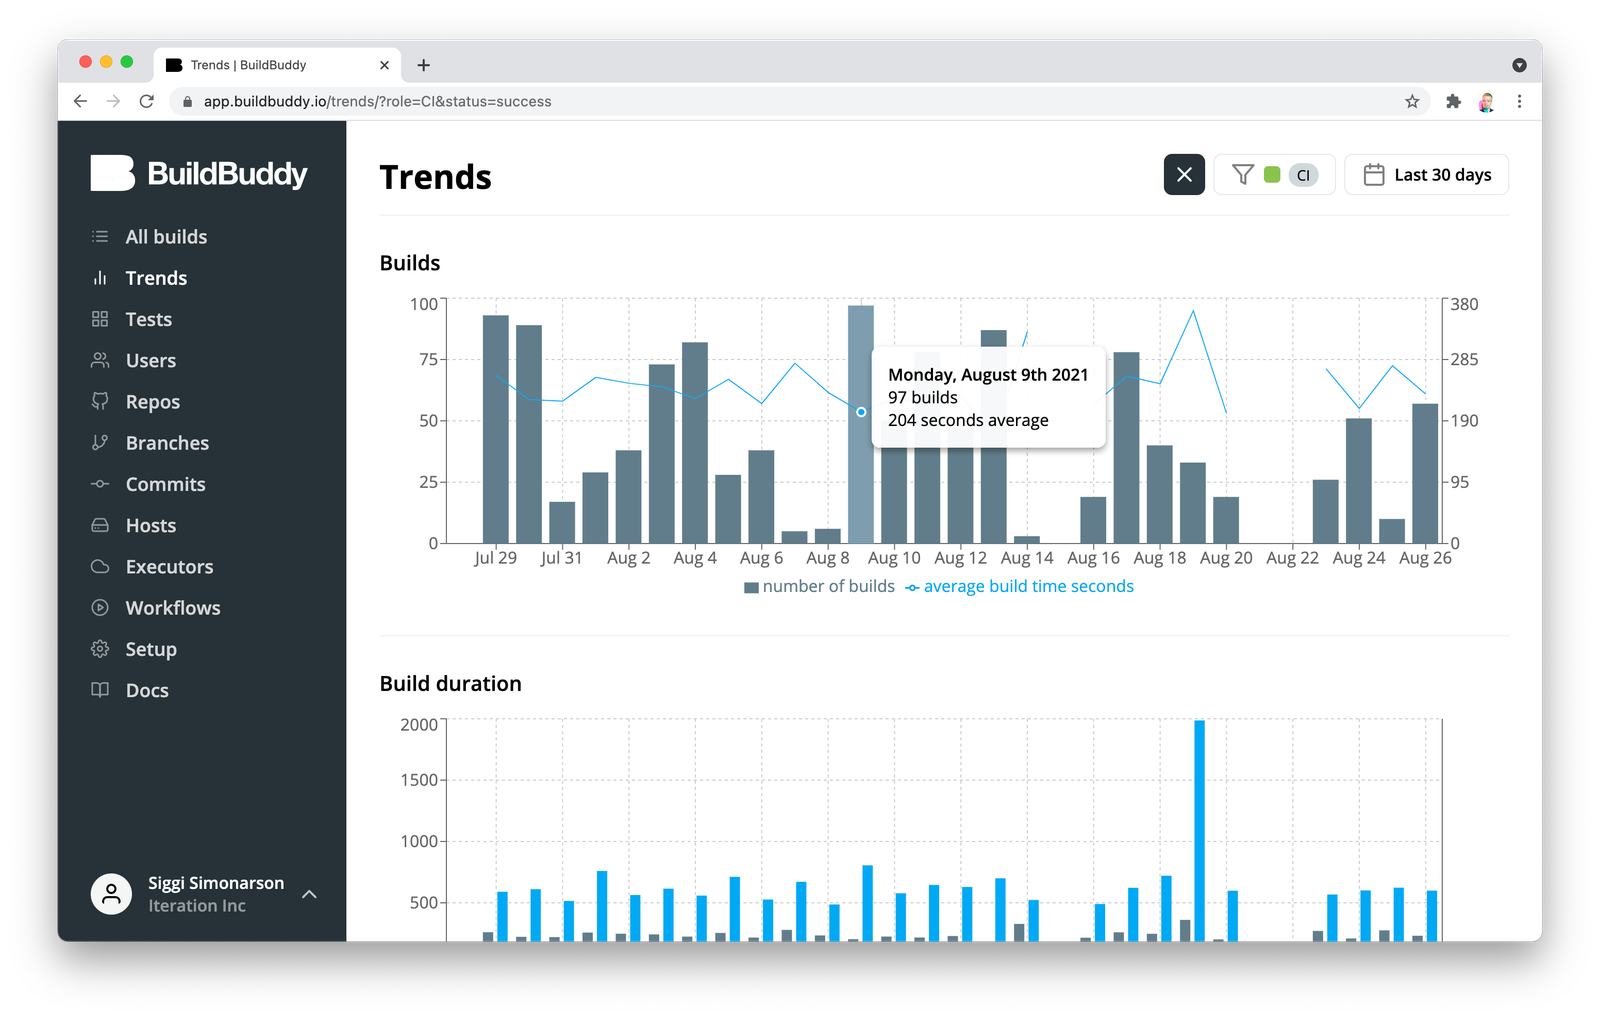
Trends
Track how your build performance is changing over time. Catch performance regressions and validate performance optimizations.
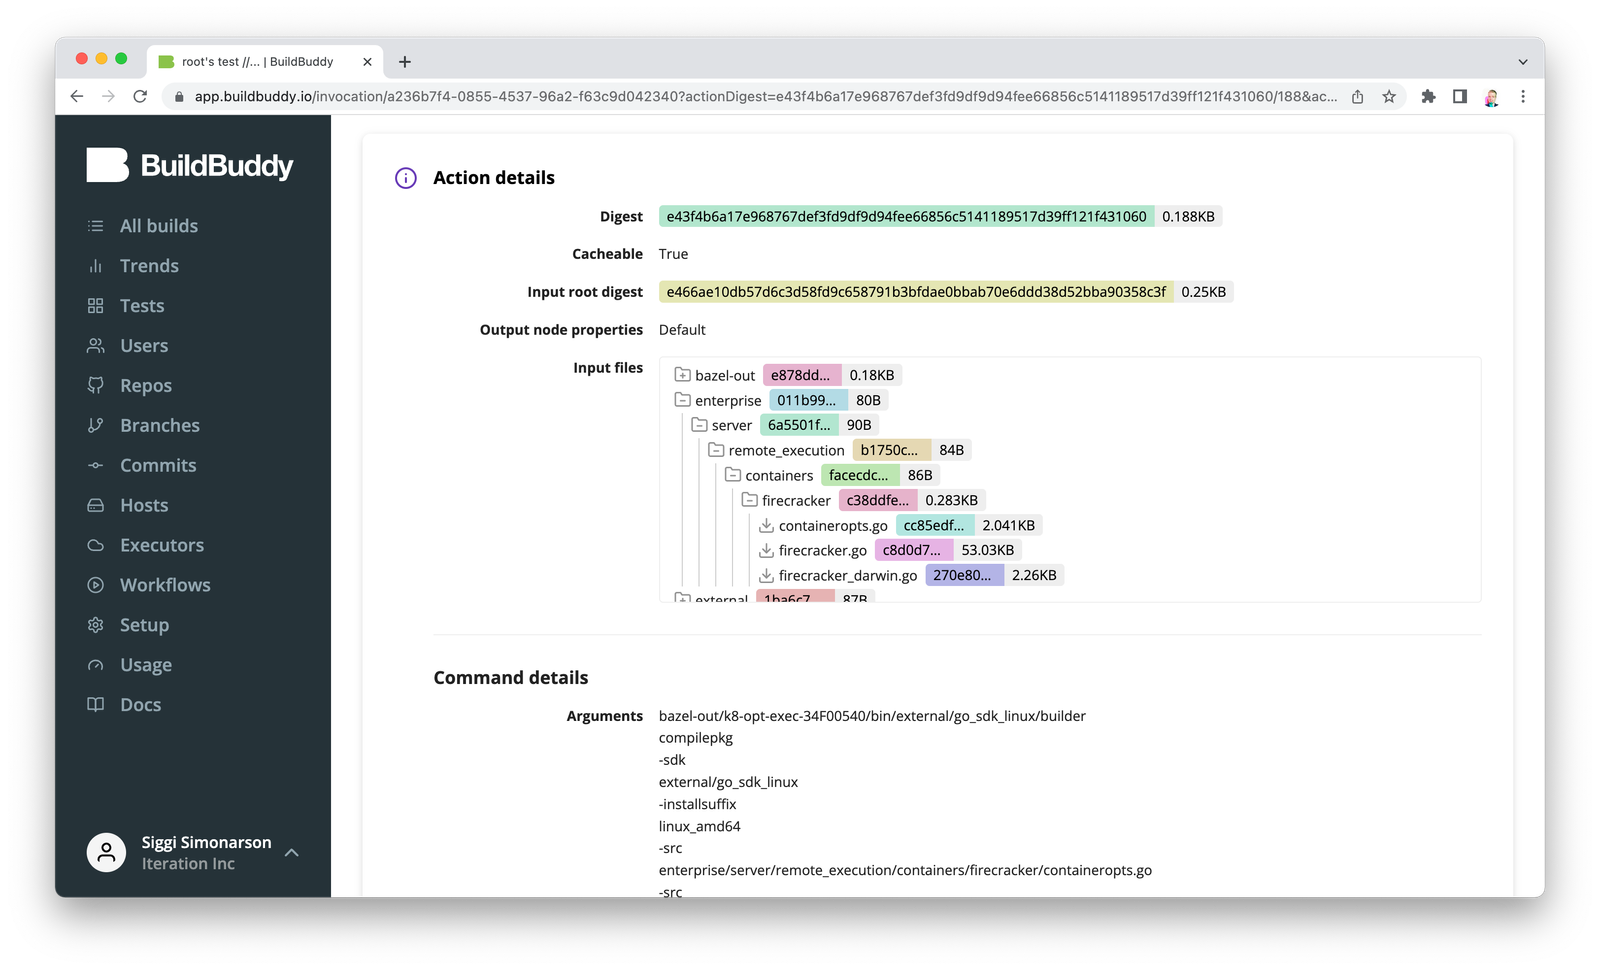
Action explorer
View input files, command details, environment variables, timing information, output files, and more for each individual action.
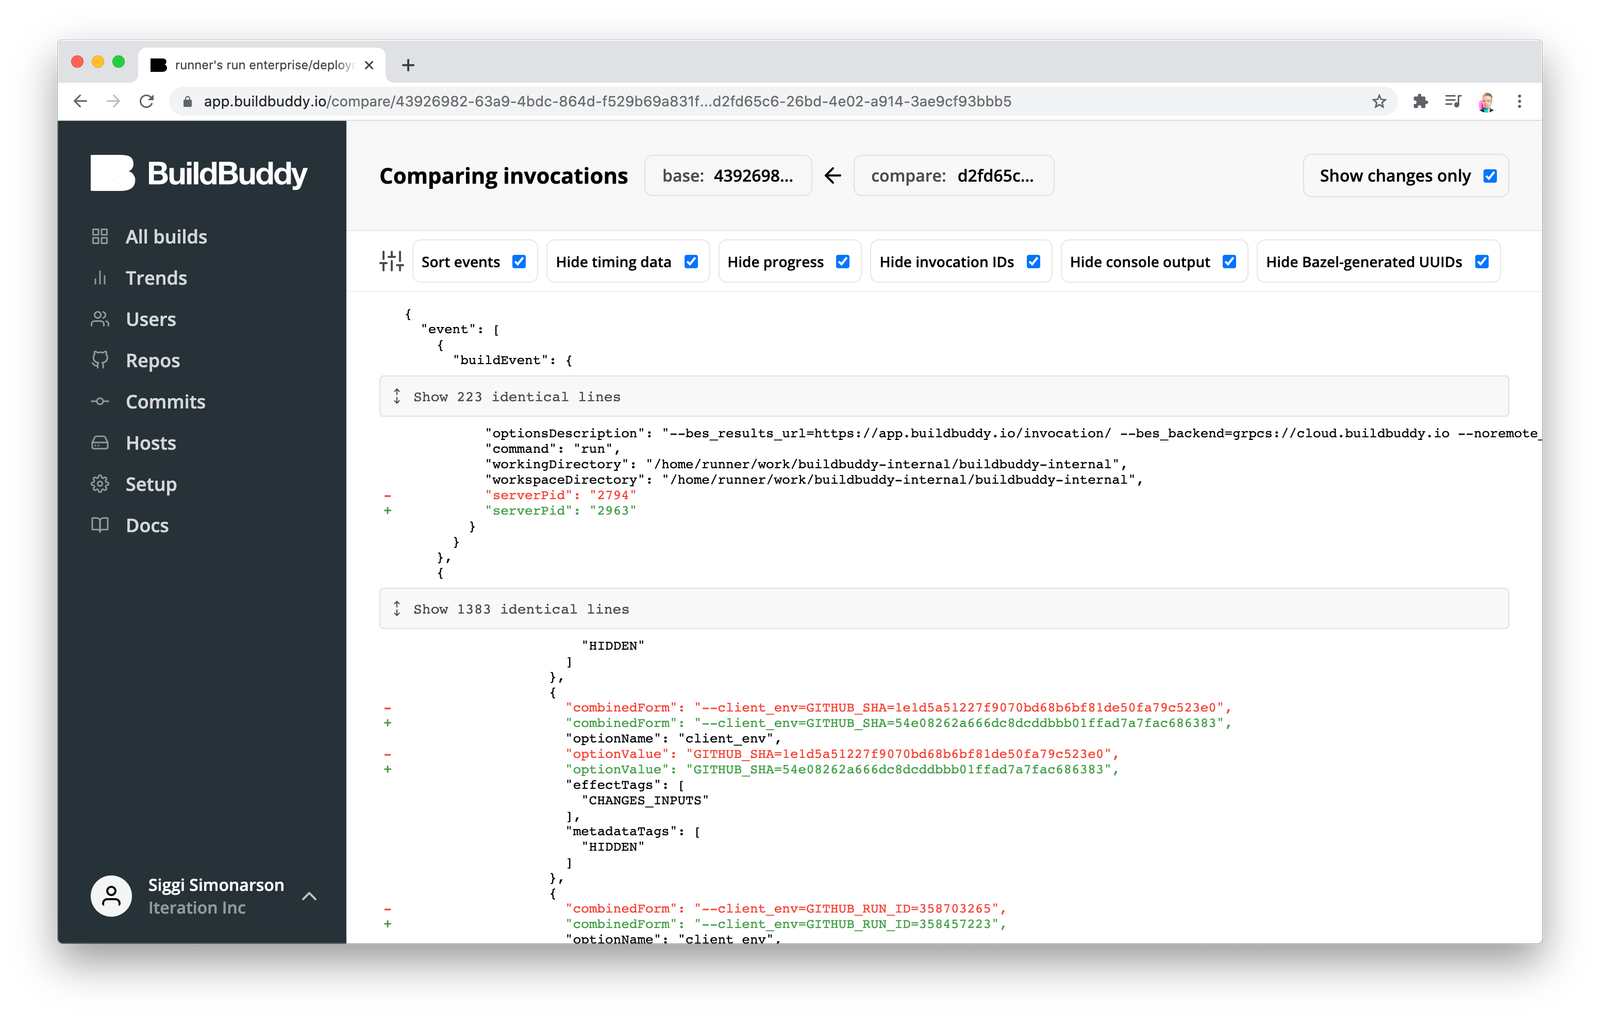
Invocation diffing
Automatically compare two Bazel invocations to see what changed. Find out why the build "works on my machine".
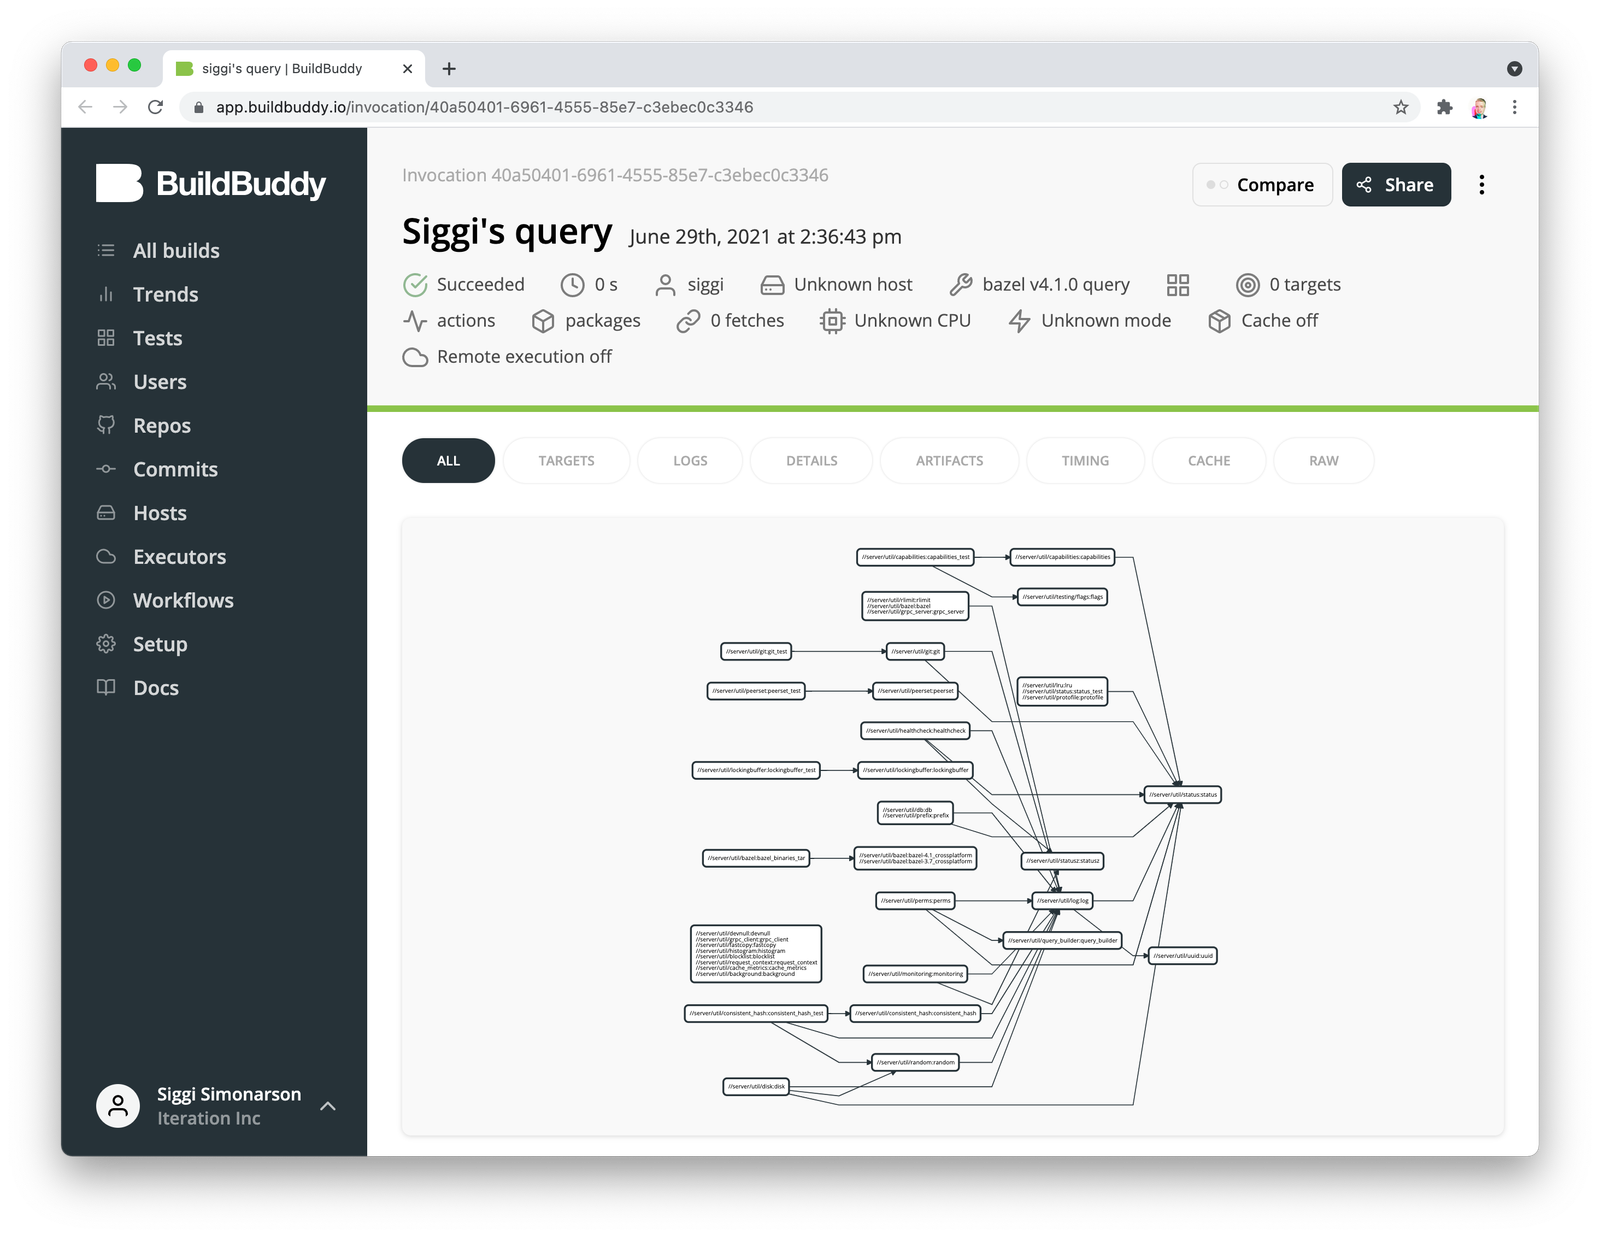
Dependency graph
Visualize the dependencies between your targets using Bazel's powerful query tool.
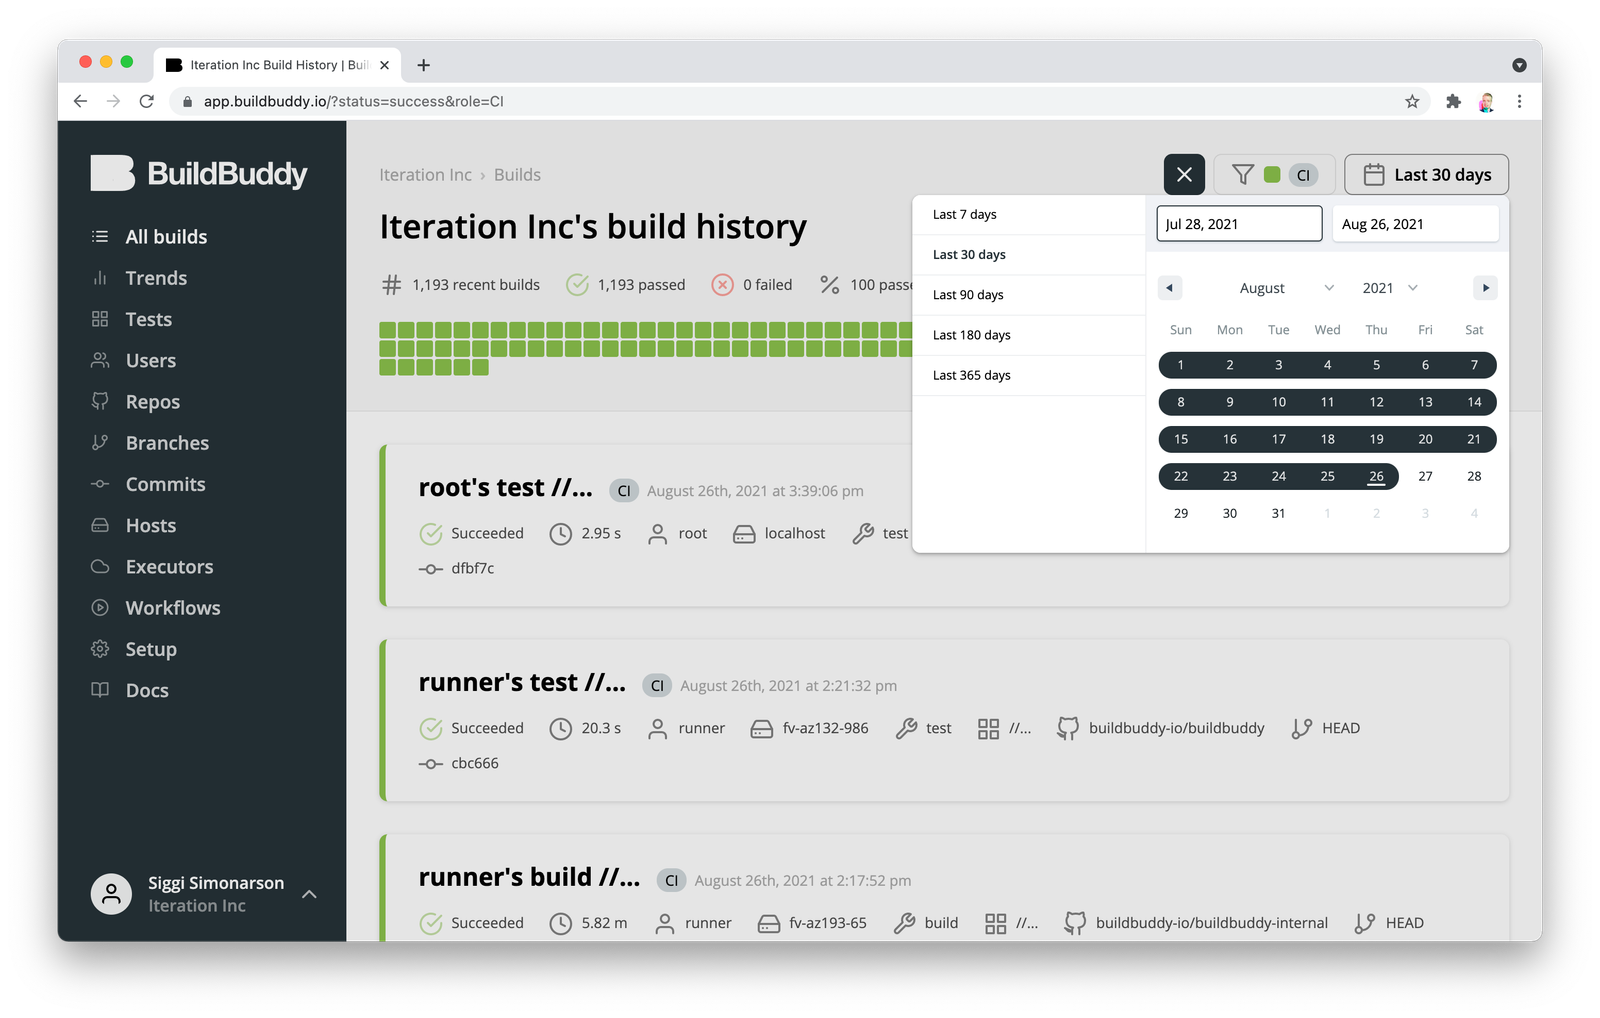
Team build history
View builds across your organization. Filter by date range, user, repo, branch, commit, host, CI, and more.
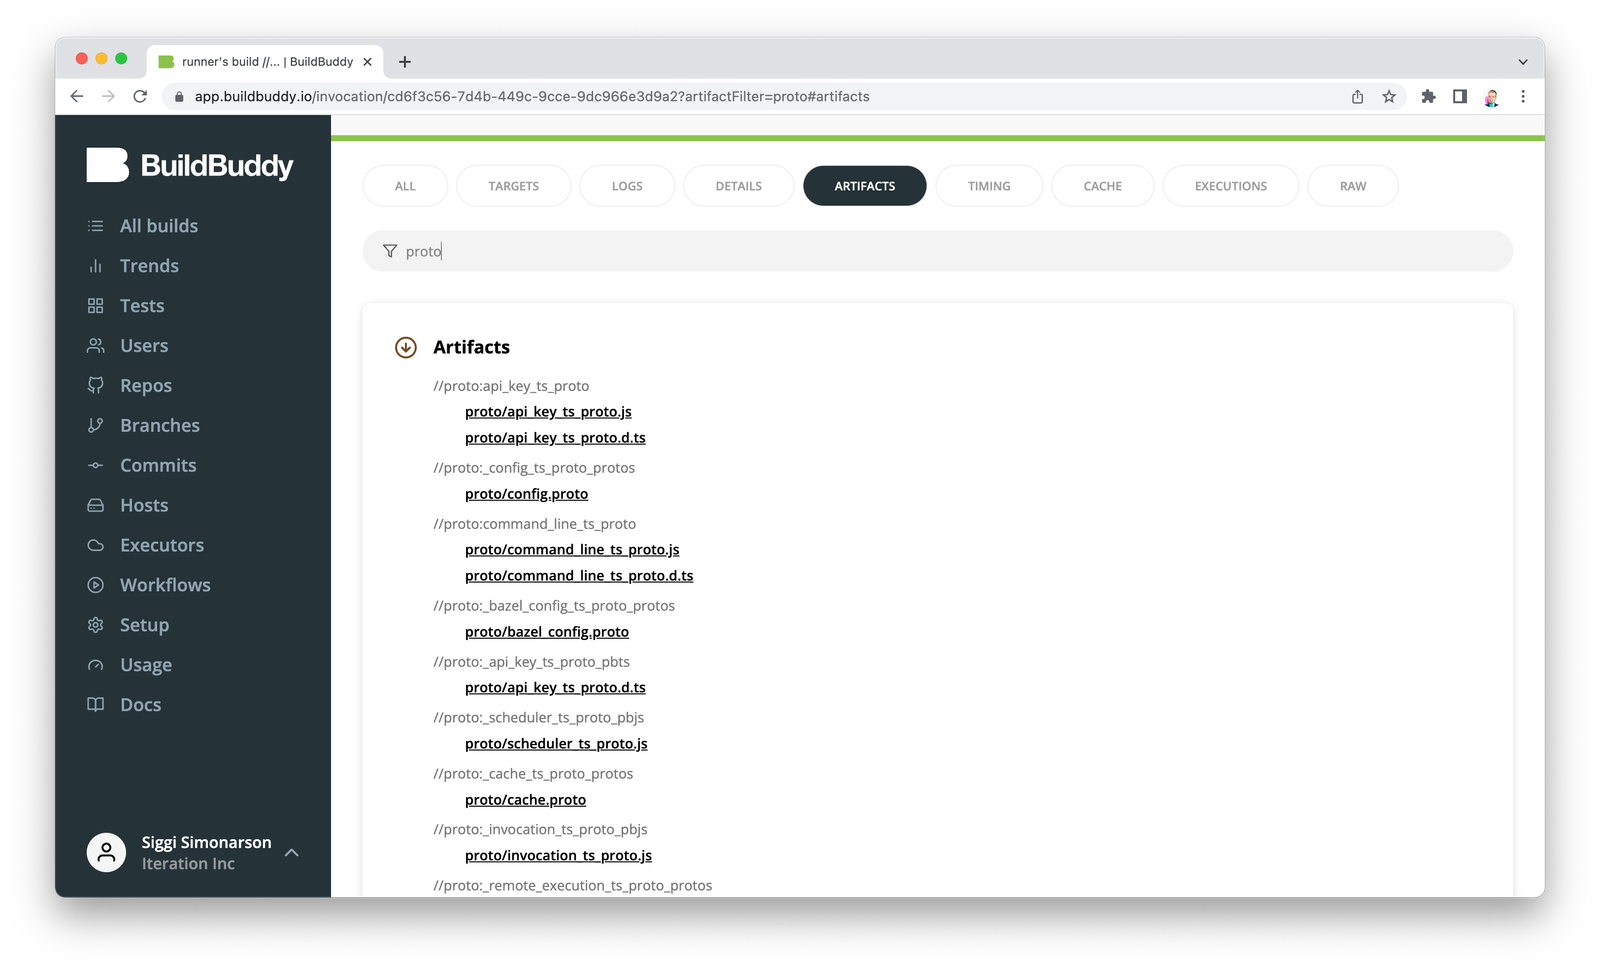
Download artifacts
Download the outputs of your builds from the remote cache with just a single click.
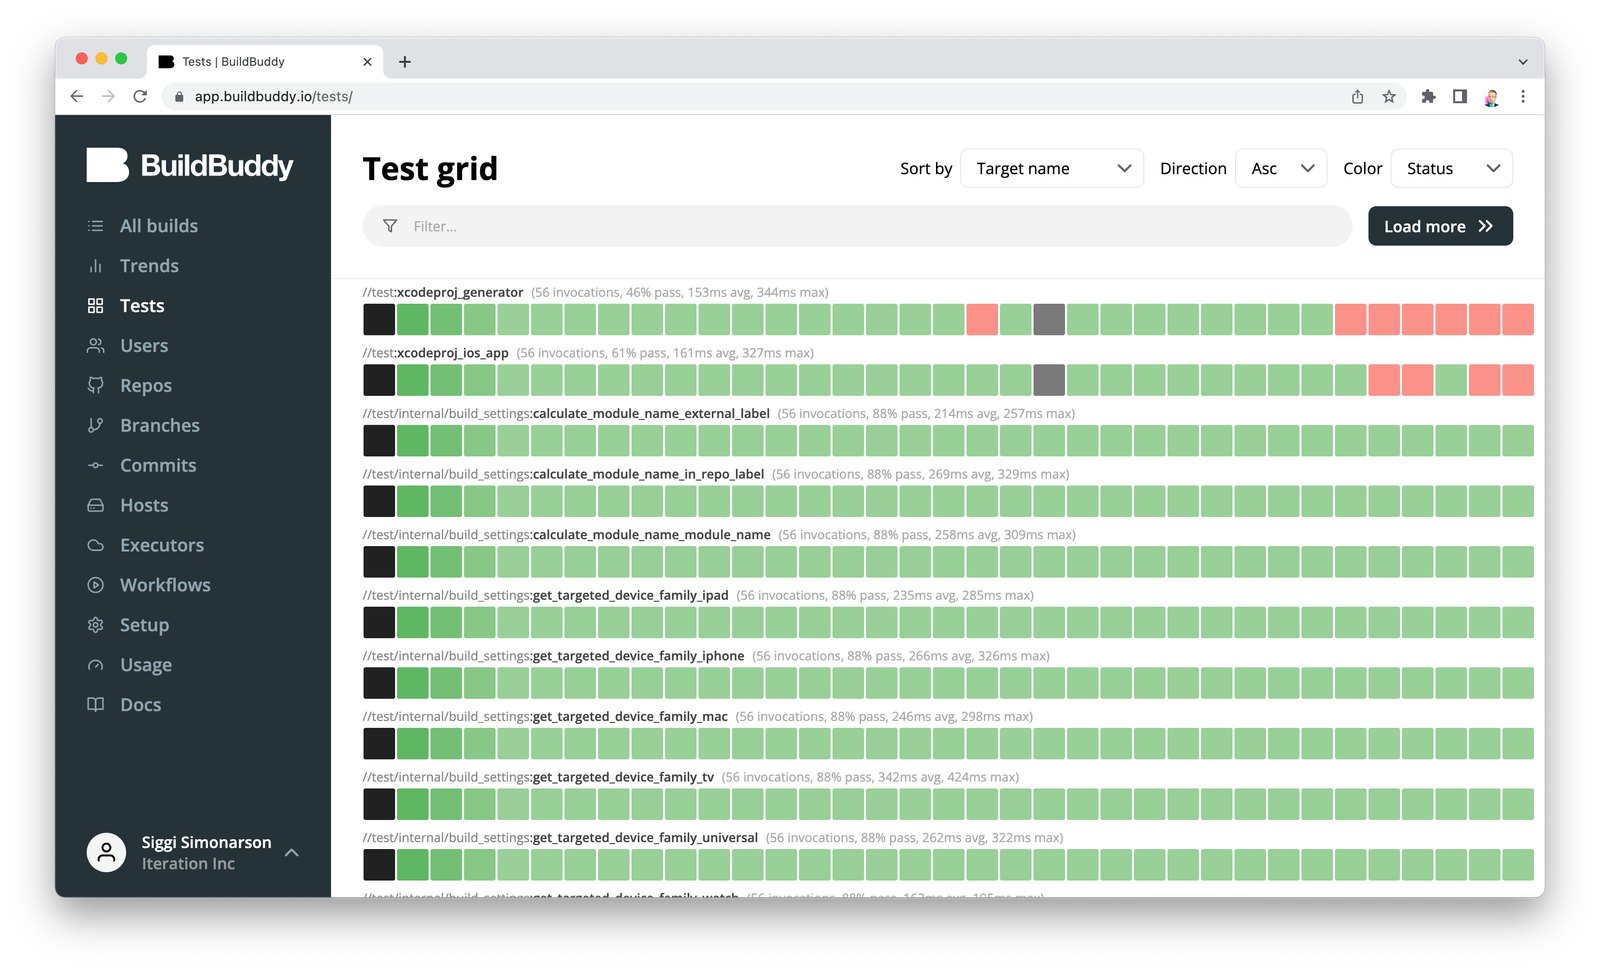
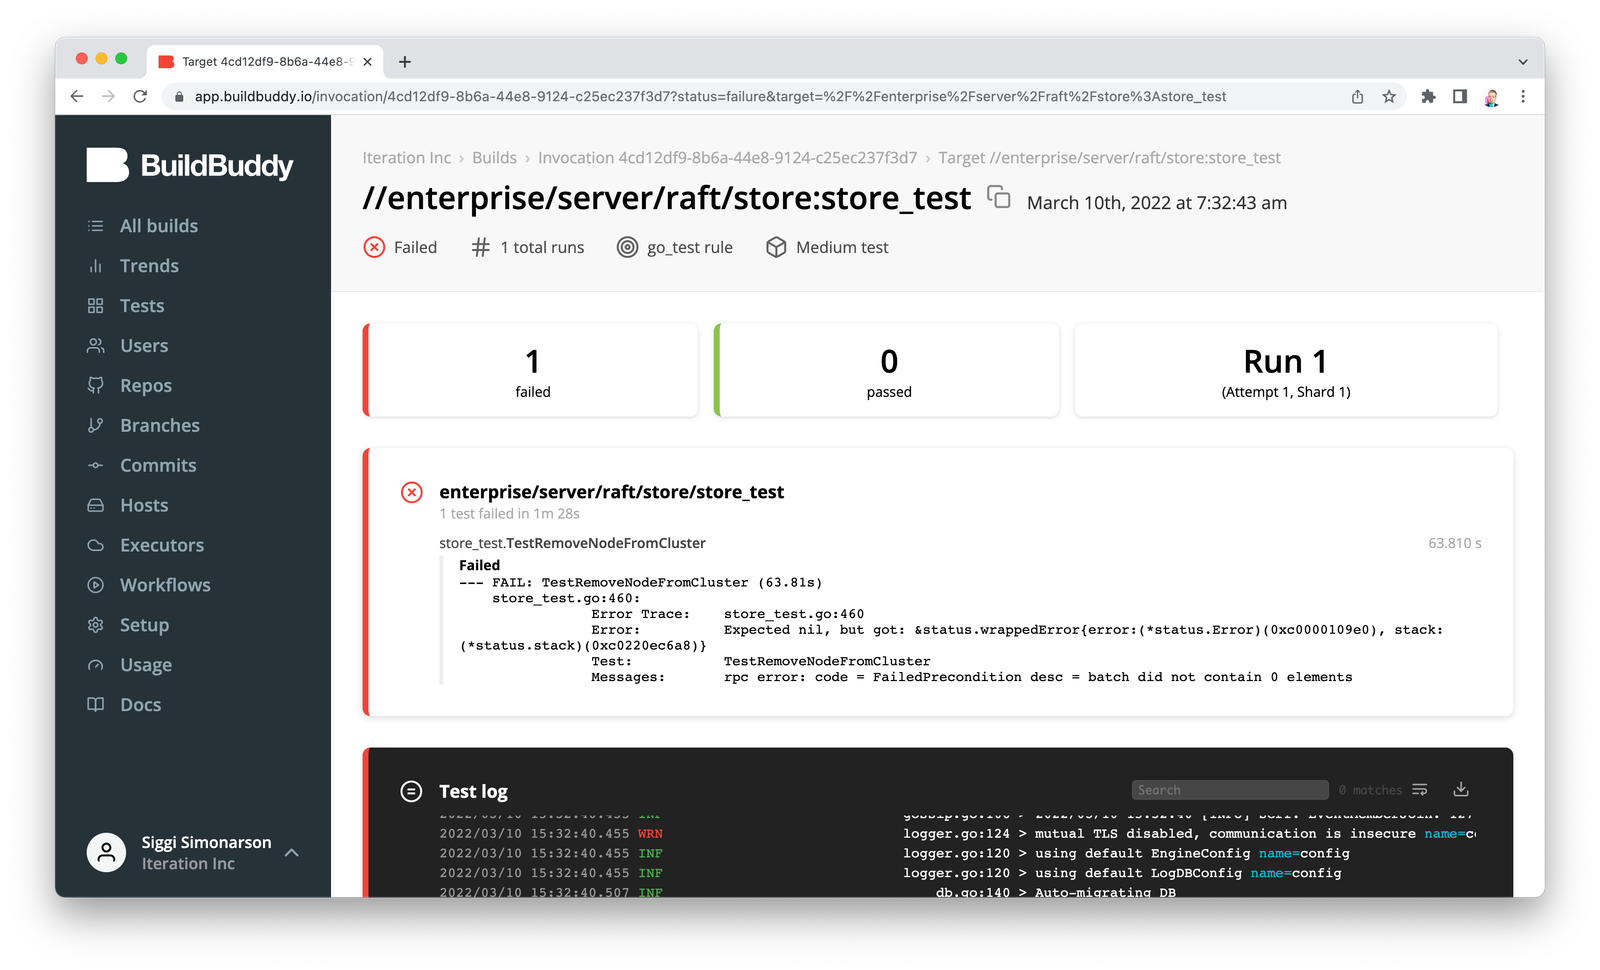
Test grid
Quickly find and fix flaky tests. Click on past failures to see test logs from failed runs to identify patterns.
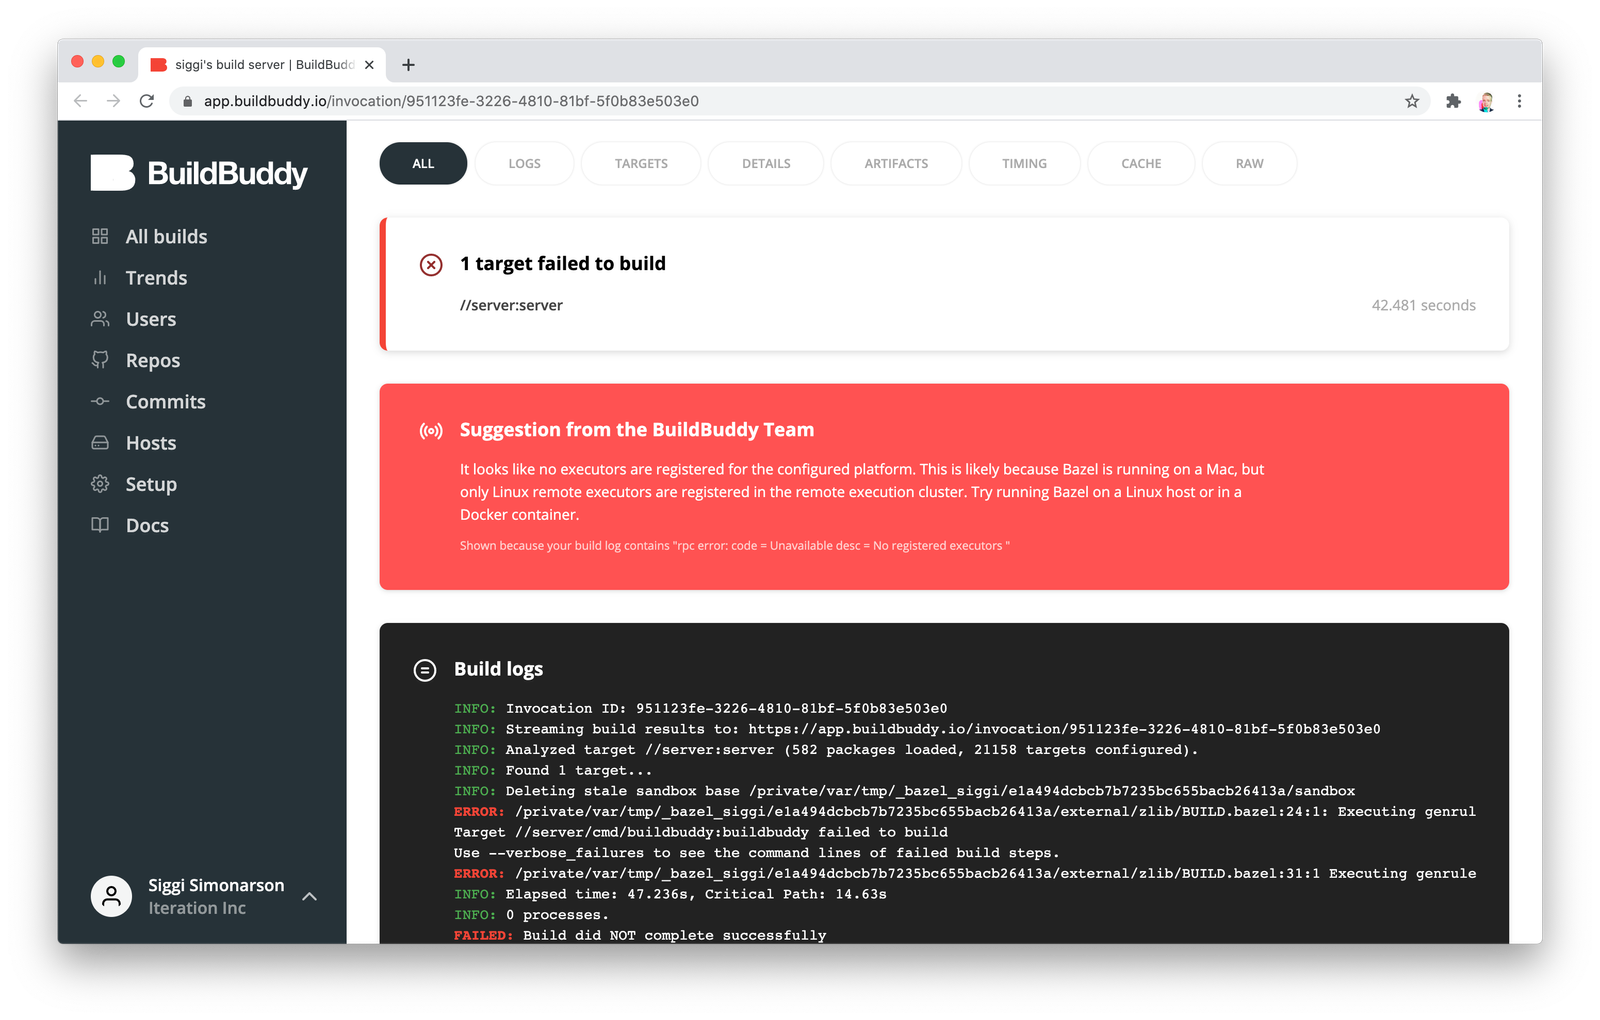
Suggestions
Get relevant suggestions on how to improve your builds surfaced inline — right when you need them.
Live updates
See the current state of your builds and tests in real-time, whether they're local or on CI.
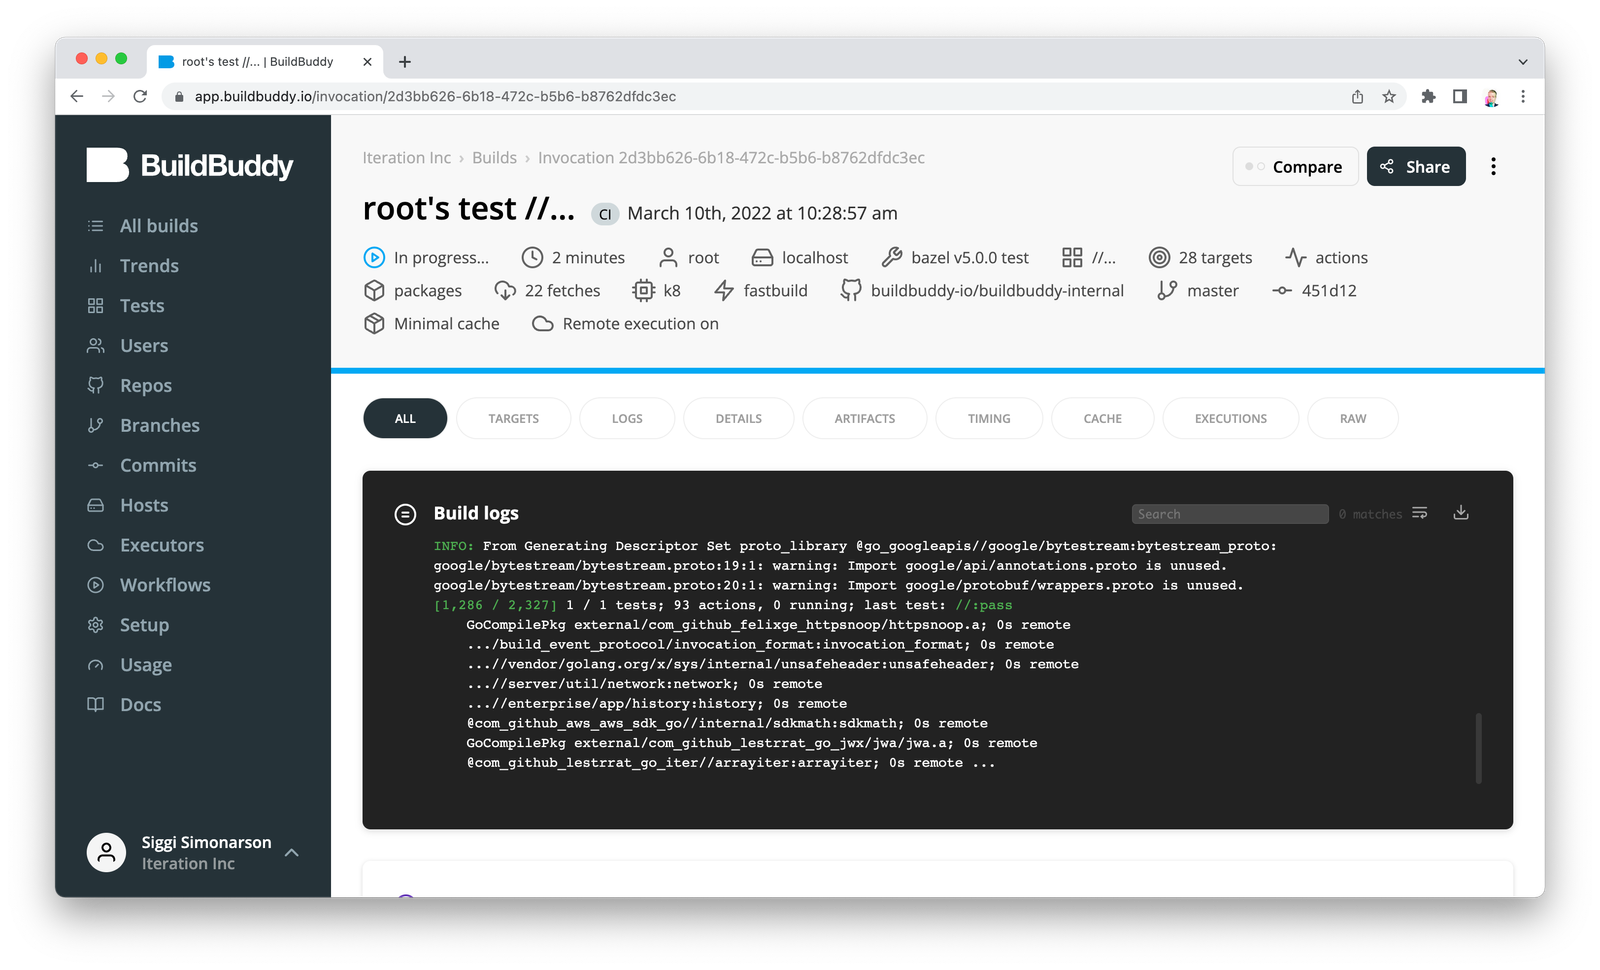
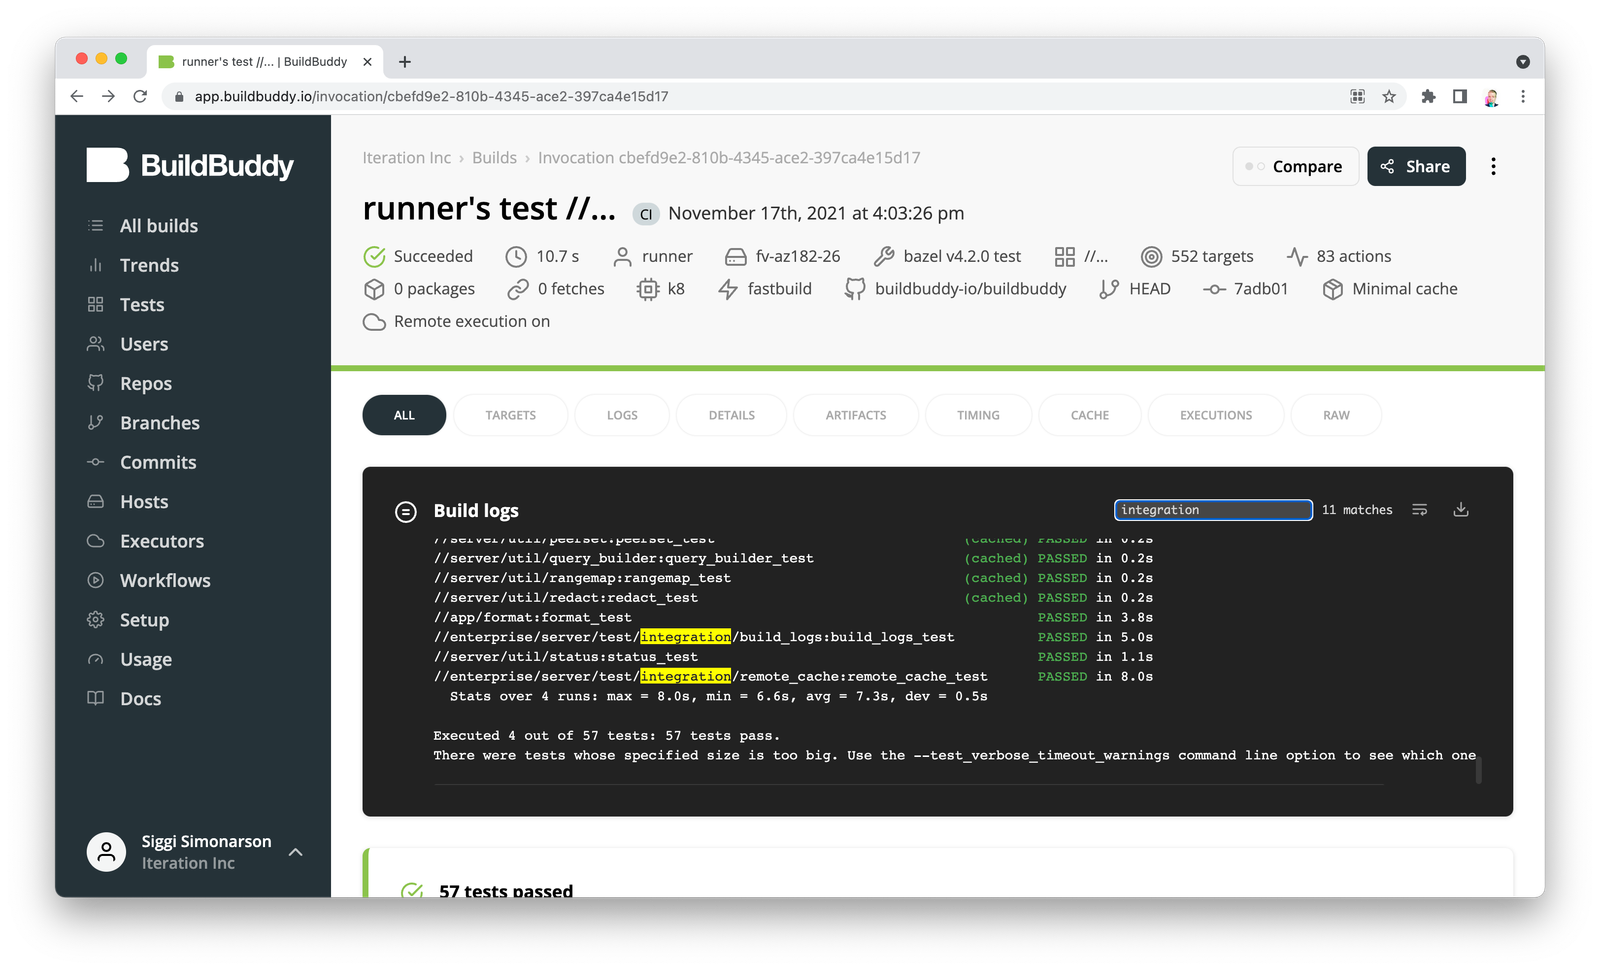
Test log parsing
Test outputs are parsed and rendered in an easy to navigate UI, with any failures bubbled to the top.
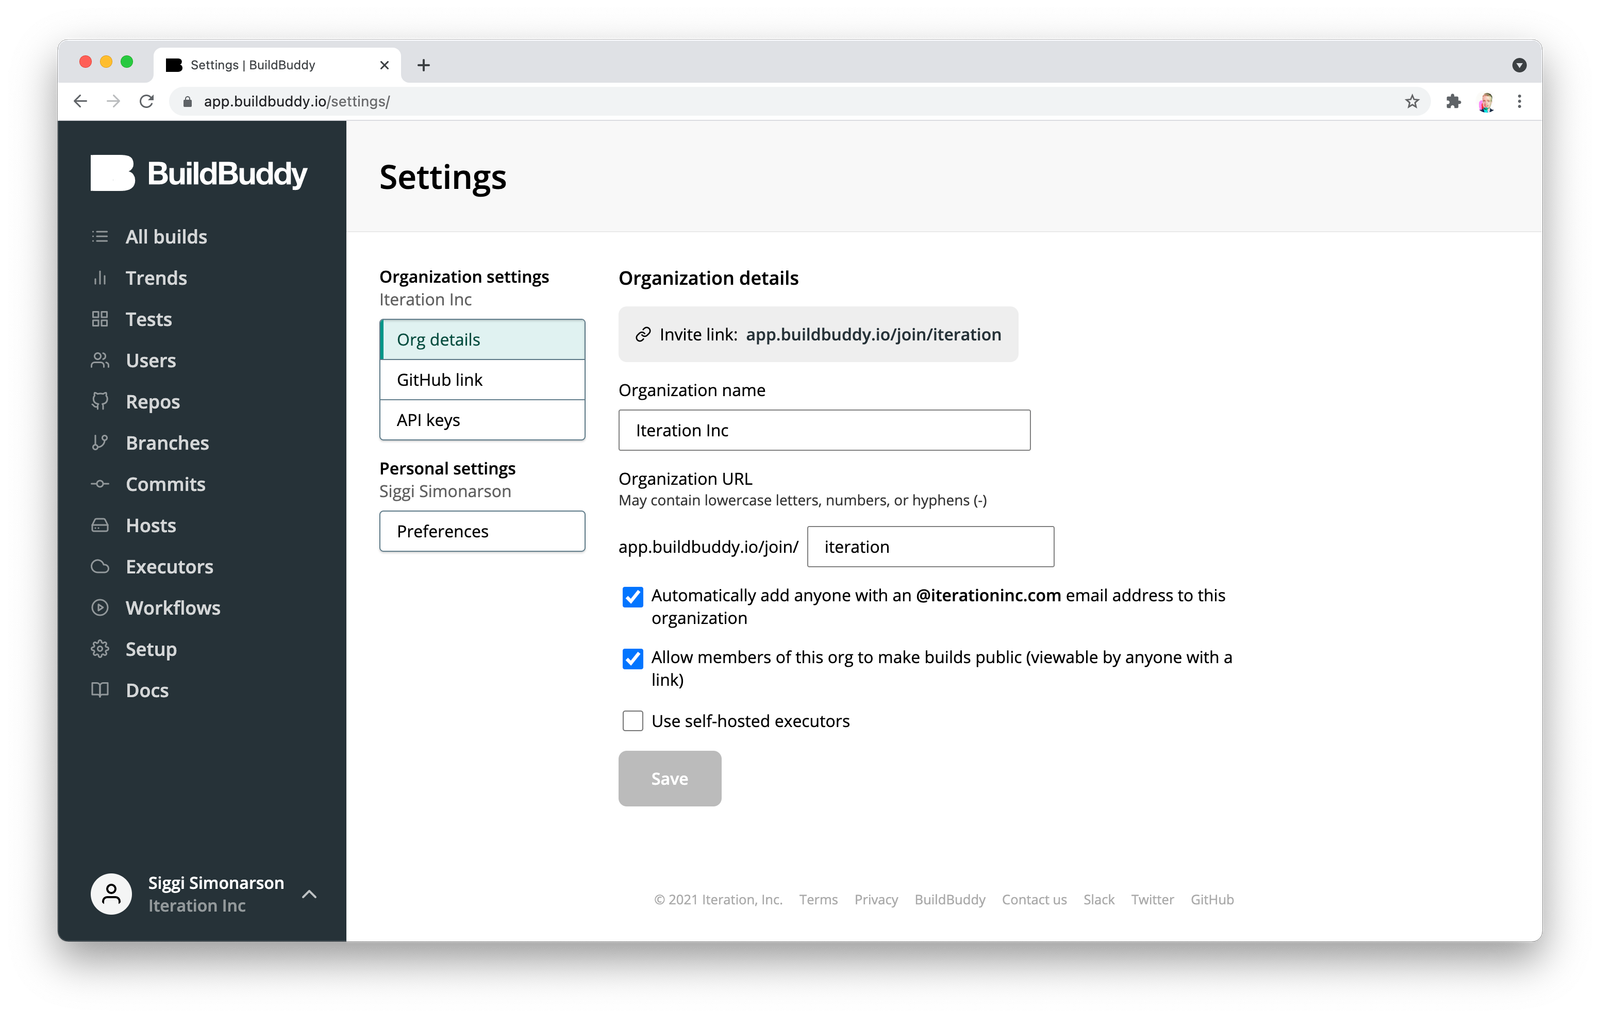
Organization management
Create multiple organizations and manage members, roles, API keys, and more. SSO — check, SAML — check, OIDC — check.
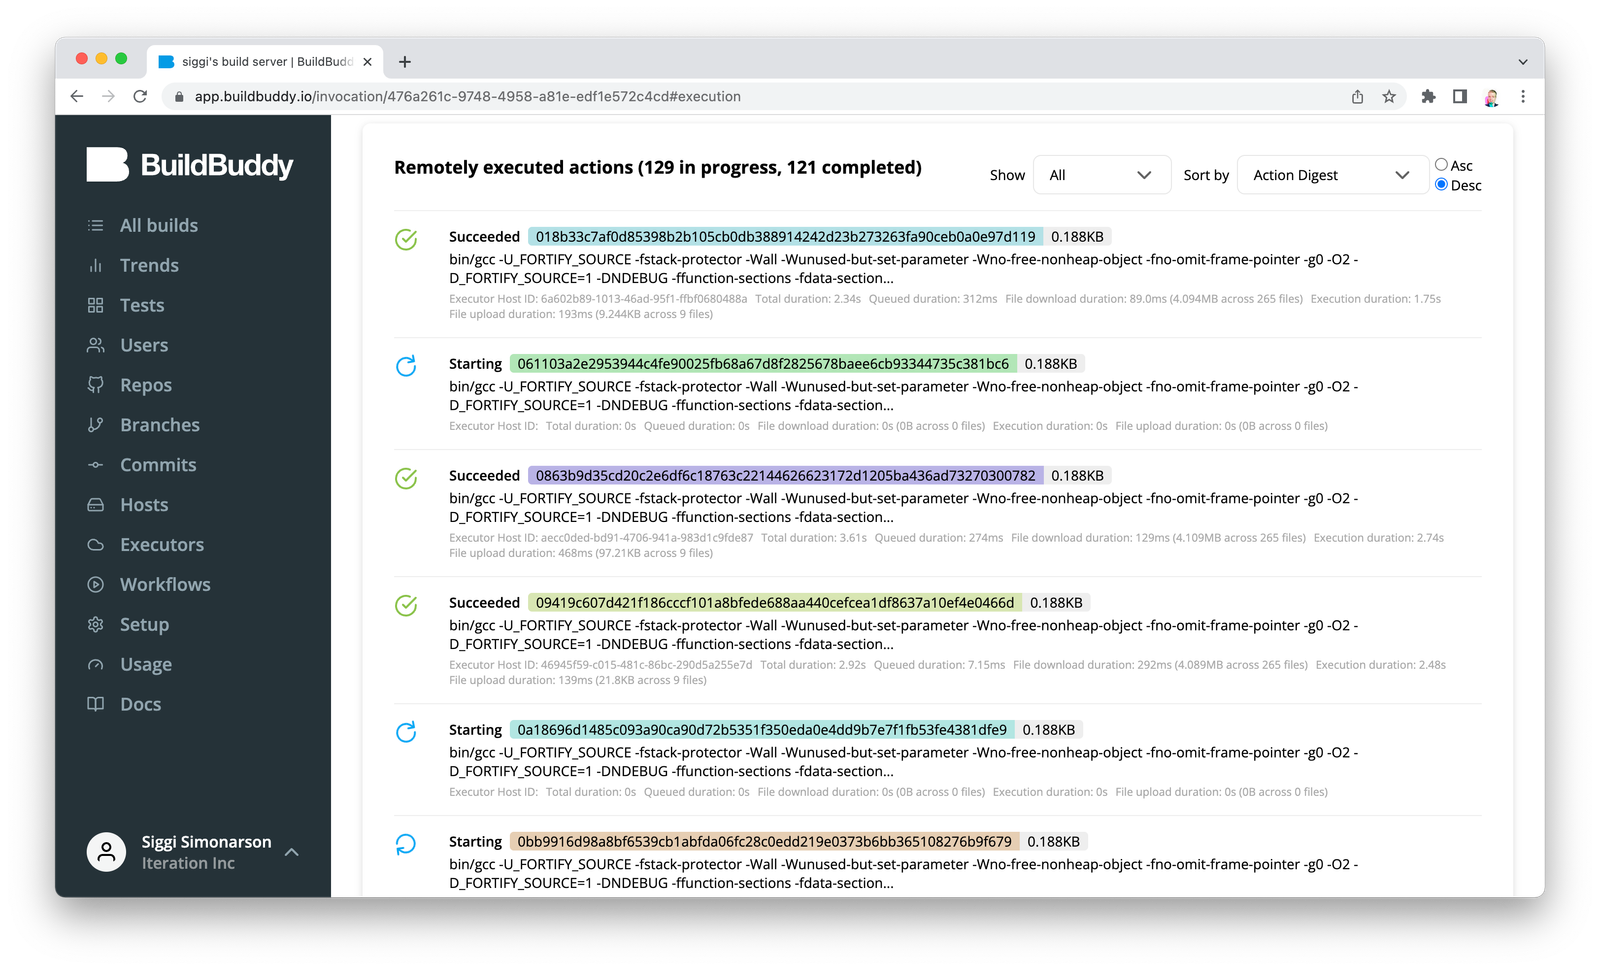
Live remote execution view
Watch remotely executing actions live, as they're happening.